
Dashboard General Report
Data and statistics are vital for your ability to draw conclusions and improve your marketing practices.
On Flashy you will find reports that display the performance of your account's tools: emailing, SMS, automations, and popups.
Additionally, you can see on the main screen a dashboard containing general data about the account, based on the information you imported as well as the events that are reported to Flashy in real-time.
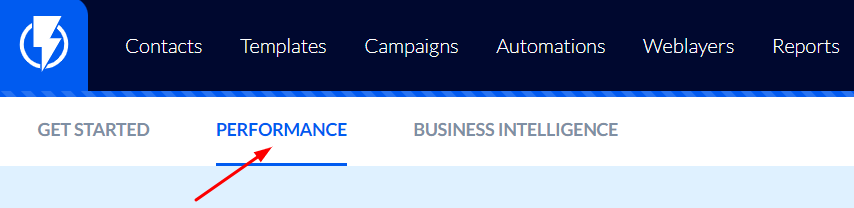
Click "Performance".
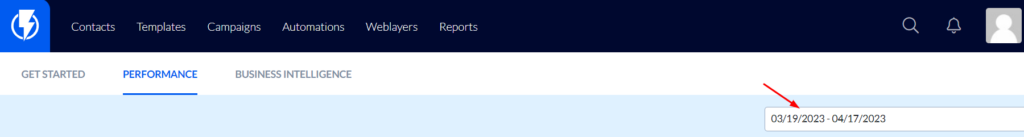
In the upper right-hand corner of the screen, you may set a desired time frame for the data you wish displayed.
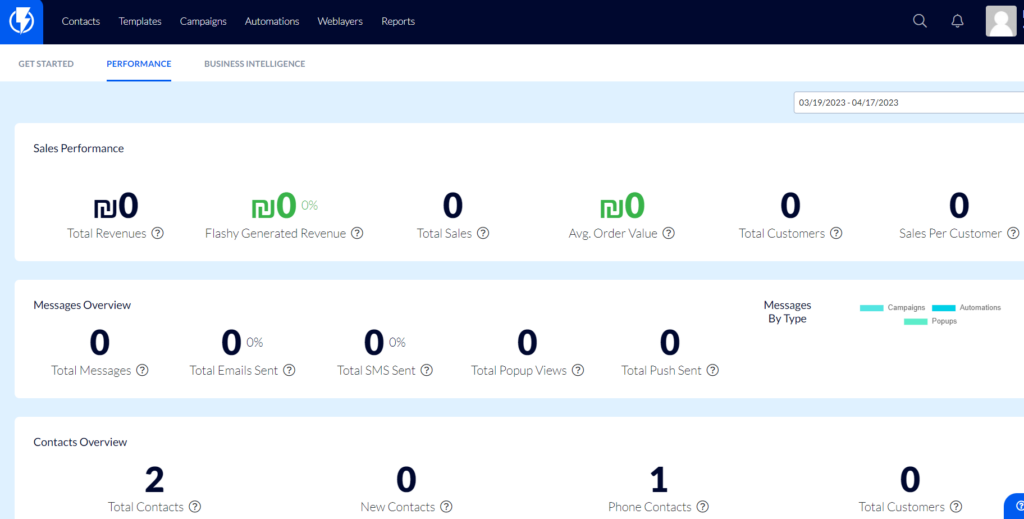
Sales Performance
Under "Sales Performance" you can see:
Total Revenues – the total revenue generated in the selected time frame (overall – not just revenue attributed to Flashy).
Flashy Generated Revenue – the total revenue generated that is attributed to Flashy, in the selected time frame (click here for a detailed explanation of Flashy's attribution model).
Total sales – the total number of sales executed in the selected time frame (overall).
Avg. Order Value – the average revenue per purchase in the selected time frame.
Total Customers – the total number of customers who made purchases in the selected time frame.
Sales Per Customer – the total number of purchases (made in the selected time frame) divided by the total number of customers who made purchases within the selected time frame (overall figures, not only activity attributed to Flashy).
Messages Overview
Under "Messages Overview" you can see:
Total Messages – the total number of messages that customers received (emails / push / SMS / popups) in the selected time frame.
Total emails sent – the total number of emails sent in the selected time frame (only all the emails sent from Flashy – from campaigns and automations).
- Next to the number of emails you can also see the percentage of all the emails that were opened out of all the emails that were sent from the account in the selected time frame.
Total SMS messages sent – the number of SMS messages that were sent in the selected time frame (only all the SMS messages sent from Flashy – from campaigns and automations).
Total push notifications sent – if you have an application interfaced with Flashy, here you can see the number of "push" notifications that you sent through Flashy in the selected time frame.
Total Popup Views – the number of visitors who were exposed to Flashy popups in the selected time frame.
Messages By Type – here you can see a division of the data regarding the different channels displayed on a pie chart.
Contacts Overview
Under "Contacts Overview" you can see details about contacts:
Total Contacts – the total number of contacts you have on Flashy (regardless of the time frame selected).
New Contacts – the number of contacts that were added to Flashy in the selected time frame.
Phone Contacts – the number of contacts on Flashy for whom you also have phone numbers (regardless of the time frame selected).
Total Customers – the total number of customers who made purchases in your store (generally, not only those attributed to Flashy and regardless of the time frame selected).
