
Automation Reports Overview
Reports are essential to understanding your customer engagement and improving your marketing. Flashy features information-packed automation reports that are clear and easy to navigate. This article provides an overview of the report features.
To get started, go to Reports in your Flashy dashboard at the top of your screen. Click on “Automations” in the dropdown menu.
This screen is your center for Automation reports. Select the time period you want to include in your report by adjusting the date range in the upper right-hand corner.
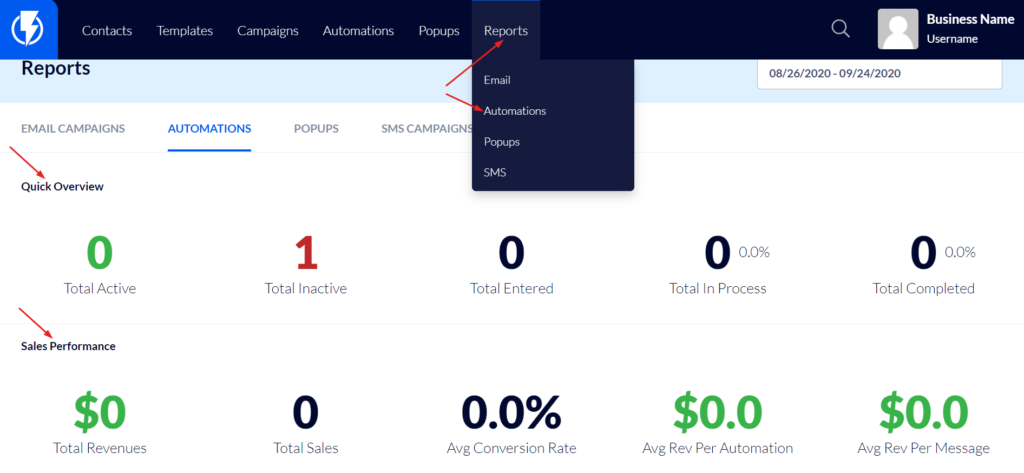
Quick Overview
The Quick Overview includes the numbers on the following categories:
- Total Active - Number of current automations. “Active” means that the automation is available for customers to enter.
- Total Inactive - Number of automations that are in a paused state. They are not available for customers to enter.
- Total Entered - Number of people who have entered an automation within the selected timeframe.
- Total in Process - Number of people currently in an automation journey.
- Total Completed - Number of people who have completed an automation.
Following are a few scenarios that explain these terms further:
- Say that you start an automation when a customer enters their email address to subscribe to your newsletter. At this moment, they enter the automation. The “entered” status begins the moment the customer completes an action that triggers the automation. Once they have entered, you might specify that only one action should follow: to send them an email. Once the email is sent, that’s the end of the automation; it is completed.
- Alternatively, you might choose to add a wait of seven days after the email was sent, and not add any further actions after that. This will mean that the customer is in process from the time they enter the automation until they reach the seven day wait. If there is no further action added, they will have completed the automation upon reaching the wait.
Sales Performance
The Sales Performance category displays these numbers:
- Total Revenues
- Total Sales
- Average Conversion Rate
- Average Revenue Per Automation
- Average Revenue Per Message - Since automations are multi-channel - including email, SMS, and push notifications - this breaks down the revenue per message type.
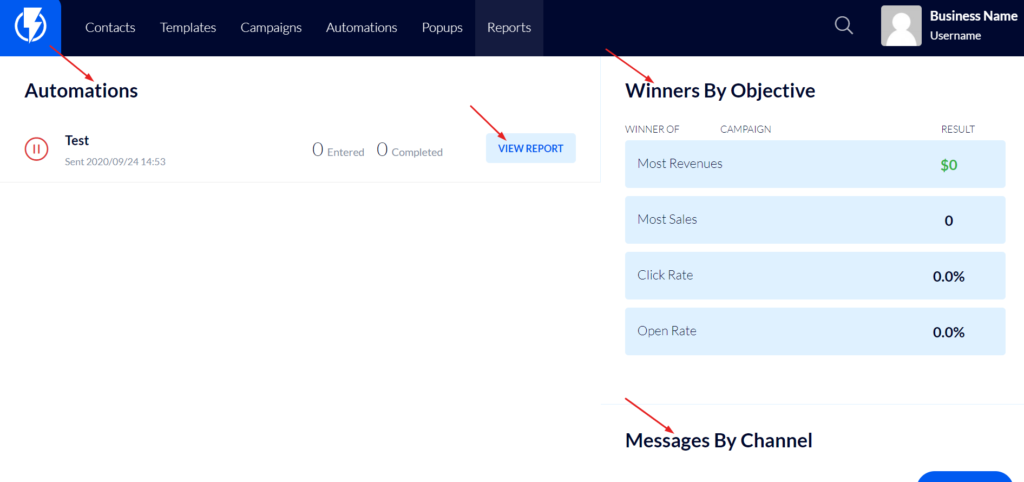
Automations
In the Automations section, you can click on individual automations to view the numbers and see how each one performed.
Winners By Objective
Winners By Objective compares your automations for you to see which ones performed the best, saving you loads of time and effort! Easily view which automations came out on top in terms of revenue, sales, click rate, and open rate. With this information, you can recreate what worked best for future automations by focusing on the specific products or offers that were most effective.
Messages By Channel
The Messages By Channel section contains a pie chart that breaks down the number of automations by channel: email, SMS, and push notifications.
Thanks for reading our overview of automation reports. To learn more, check out our article on “Individual Automation Reports” to drill down further into the powerful knowledge Flashy’s reports provide.
